
Core Web Vitals: reading the signals without getting lost in scores
What LCP, INP and CLS really measure, why the score out of 100 means almost nothing, and how to connect performance to the rest of your audit.
Core Web Vitals are three metrics, and the overall score out of 100 isn't one of them. Remember that sentence and you'll avoid most of the bad decisions people make on the topic.
The three metrics, one question each
LCP — Largest Contentful Paint
How long before the main content is visible?
Good under 2.5 s, poor above 4 s.
The real causes, from most to least common: an uncompressed or unsized banner image, a slow server response, a web font that blocks rendering, a third-party script at the top of the page.
INP — Interaction to Next Paint
How long between a click and the page's visible response?
Good under 200 ms.
This metric replaced FID, which only looked at the first interaction — almost always the best one. INP looks at all of them, which is far more honest.
The cause is almost always the same: JavaScript hogging the main thread. Third-party scripts, analytics, consent managers, chat widgets.
CLS — Cumulative Layout Shift
How much does the page move around while it loads?
Good under 0.1.
It's the metric of the button that jumps just as you click it. Three culprits: an image without
declared width and height, a late-loading font that changes the size of the text, a banner
injected at the top of the page after rendering.
It's also the easiest of the three to fix, and the one that improves the real-world experience the most.
Lab vs. field
Two data sources, often confused, that don't tell you the same thing.
Lab data — a test like PageSpeed Insights: a simulated device, a simulated network, at a given moment. Reproducible and useful for diagnosis, but sensitive to the conditions of the moment.
Field data — the experience of your real visitors, aggregated over 28 days. This is the source Google uses for its page experience signals.
The practical consequence: a lab test tells you what to fix, field data tells you whether it worked, and you have to wait several weeks for the latter.
What the score out of 100 doesn't tell you
It aggregates metrics with arbitrary weightings, some of which have nothing to do with rankings. A site scoring 62 can easily be in better shape than a site scoring 95.
It swings by ten points from one test to the next without a single line of code changing.
And above all: it diverts attention. You end up optimizing the number instead of the experience, usually by pushing work back — lazy loading on visible elements, delayed scripts that break a feature.
Look at LCP, INP and CLS. Ignore the rest.
Connecting performance to the rest of the audit
A slow page with no impressions isn't a priority. A slow page in position 4 with 8,000 impressions is.
That's the only prioritization that holds up: cross-reference performance with search data, and fix the pages that have both a problem and traffic.
And keep the orders of magnitude in mind: on most sites, an inconsistent canonical or an
important page set to noindex costs infinitely more than a 3-second LCP. Performance is real
work — it's rarely the first job on the list.
Where to start, in practice
- Measure one URL per template, not twenty pages of the same type.
- Fix CLS first: it's the cheapest fix and the most visible one for users.
- Then LCP, starting with images — they're the cause in most cases.
- Then INP, by auditing your third-party scripts. The question to ask for each one: what do we lose if we remove it?
- Measure again, and watch the trend over several weeks, not the next test.
Frequently asked questions
Will a bad PageSpeed score tank my rankings?
Not automatically. Page experience signals carry little weight compared with relevance. A slow page mostly loses visitors who give up before it loads, and that costs you more than the ranking.
Why do my scores change from one test to the next?
Because they're lab measurements, sensitive to server and network load at the moment of the test. Follow the trend across several measurements, never a single data point.
Should I aim for 100 out of 100?
No. It's an expensive goal, often reached at the cost of functional trade-offs, with no measurable effect on traffic. Aim for the “good” threshold on all three metrics and stop there.
Put this guide into practice
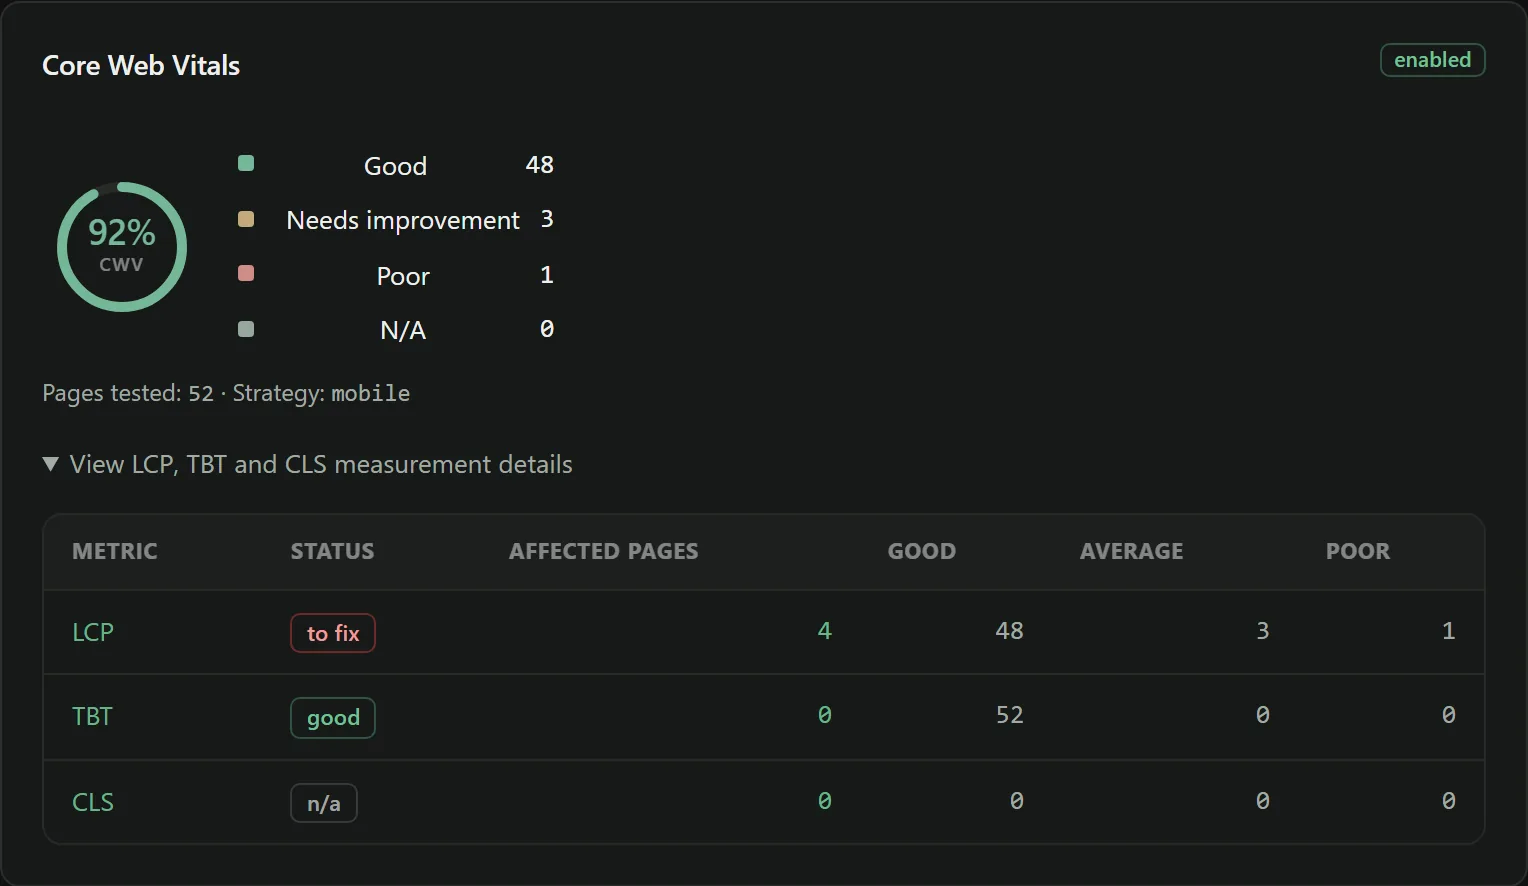
Noyaru measures Core Web Vitals on a sample of your templates at every crawl and shows them next to your Search Console impressions — so you can rank optimizations by the traffic they affect.
Create a free account View the documentation