
Read the crawl report
What the scores, the page counters, the comparison between two crawls and the sections of a project's overview mean.
When a crawl finishes, the project page becomes the overview: what the site contains, what is wrong, and what has changed since last time.
The scores
The scores summarize the site's state by family: indexability, tags, content, internal linking, performance. They serve one purpose: spotting at a glance the family that is collapsing.
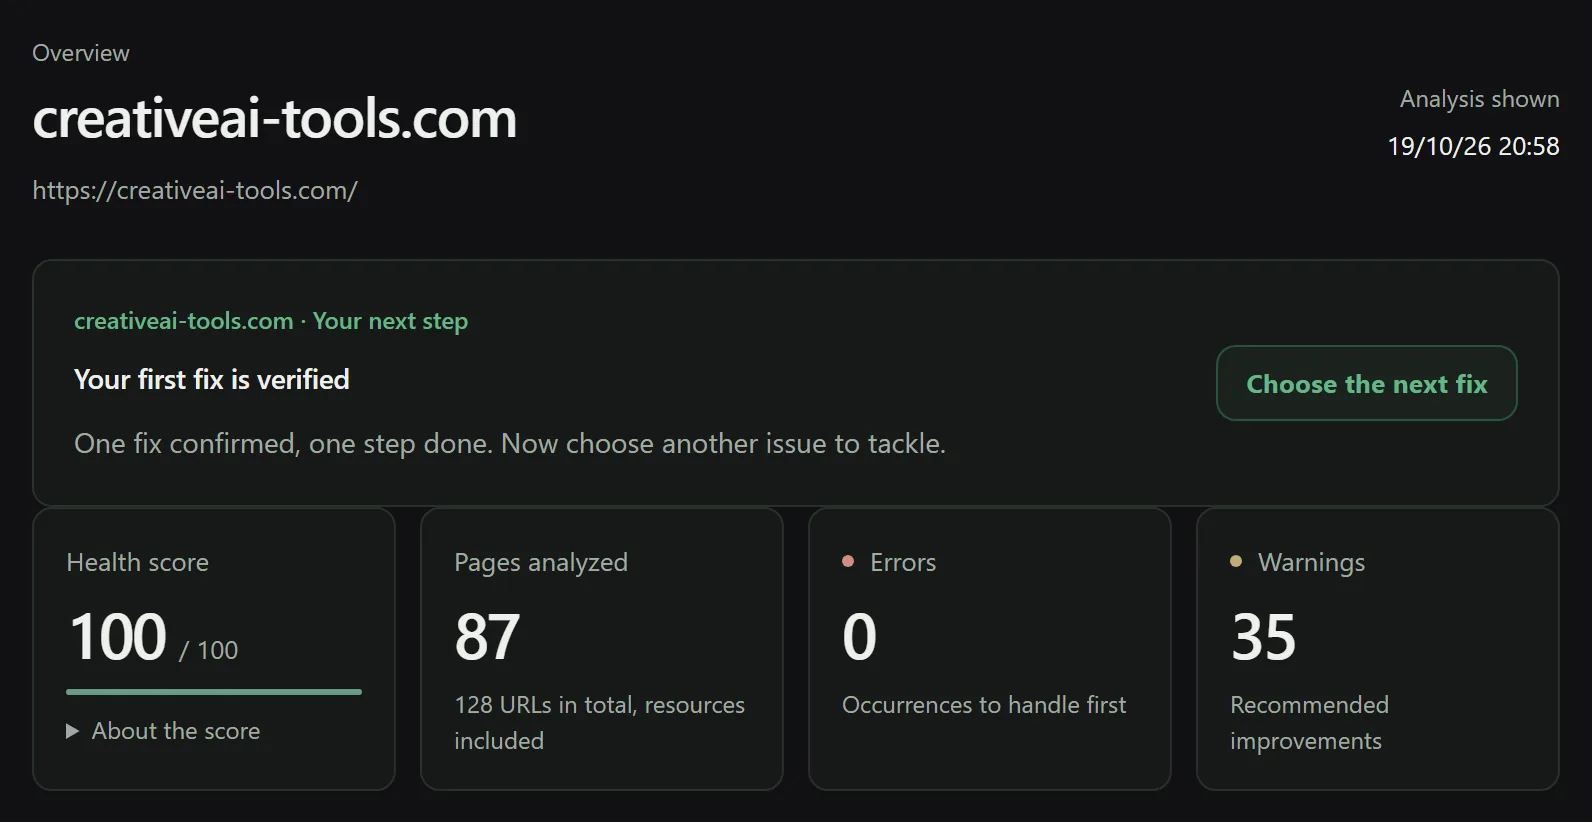
Don't mistake them for a Google rating. No search engine calculates this number, and a site at 92 can be invisible while a site at 61 is doing very well. The score is an internal thermometer, useful for tracking your own trend over time.
What really matters is below: the number of URLs affected by each issue.
The page counters
- Pages crawled — what the crawler actually reached.
- Indexable pages — those that respond with 200, are not set to
noindex, and whosecanonicalpoints to themselves. - Sitemap pages — and above all the gap with the previous ones.
The three numbers tell the story together. 800 pages crawled for 340 indexable is an indexability problem. 800 crawled and 1,400 in the sitemap is a sitemap that promises pages the internal linking does not reach.
The issues
The list sorted by severity, each row showing the number of affected URLs.
Noyaru follows an issue catalog aligned with industry standards, split into three levels:
| Level | What it means | Examples |
|---|---|---|
| Error | Prevents indexing or breaks something | 5xx, important page returning 404, noindex on a business page, redirect loop |
| Warning | Degrades understanding or crawling | duplicate title, missing h1, internal link to a redirect, image without alt |
| Notice | Good to know, rarely urgent | missing description on an archive page, very long URL, deep page |
Sorting by severity is a starting point, not a work order. A notice on your pricing page comes before an error on a 2019 archive page.
Comparing two crawls
This is the most useful view in the product, and the most overlooked.
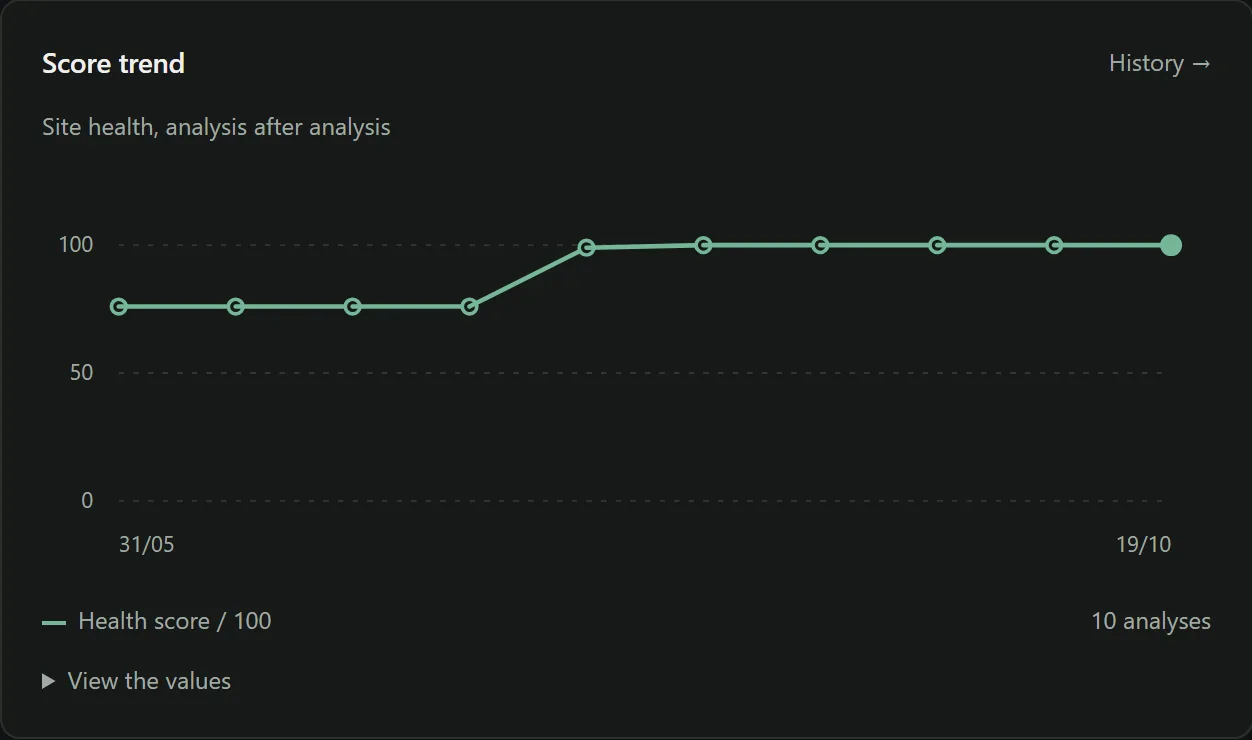
Select a baseline crawl: the overview then shows the deltas — new issues, resolved issues, pages gained or lost, change by family.
Two uses:
- After a fix. The only proof that a fix worked is that the issue is gone on the next crawl. It is also what Noyaru checks automatically for the fixes it wrote — see Verify a fix.
- After a release to production. A deployment that adds 40 issues is a regression, even if nobody notices it in the browser.
Search data
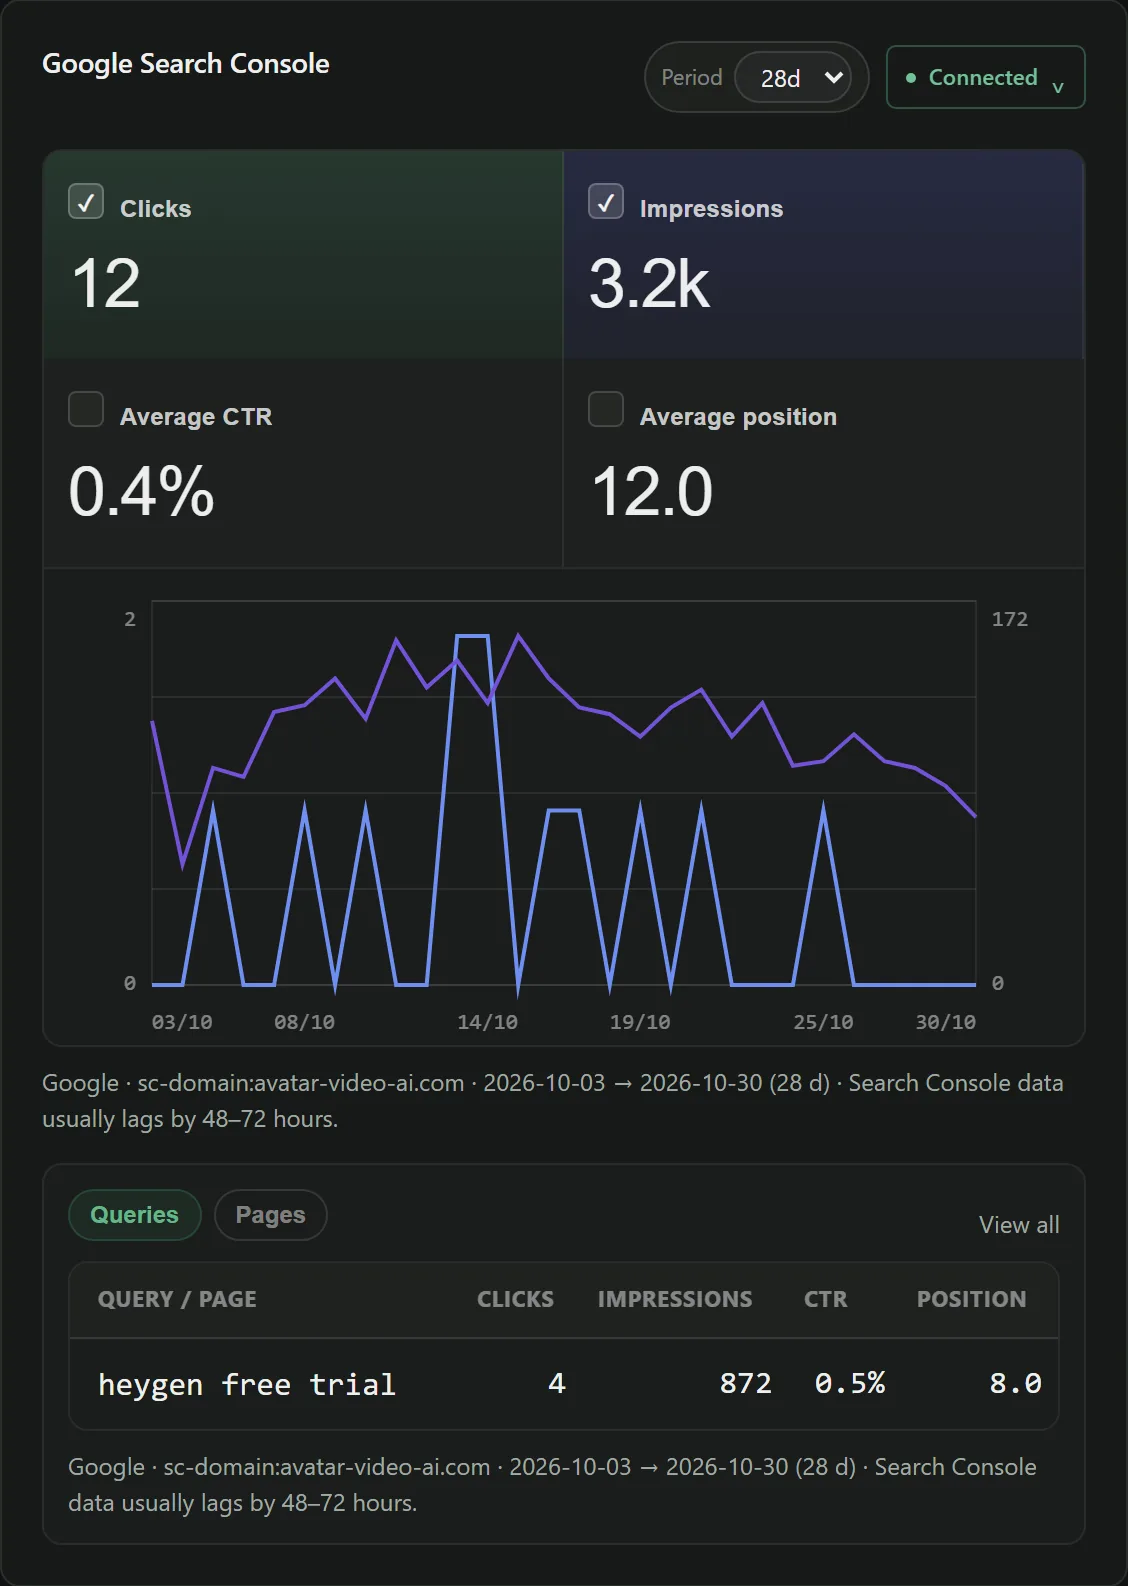
If Search Console is connected, the overview includes real impressions, clicks and positions, and issues can be prioritized by traffic. Without it, Noyaru can only sort by technical severity, which is far less relevant.
Taking the report off the screen
CSV and PDF exports from the overview and from the Issues page: summary report, full list of issues, list of URLs for a given issue.
Frequently asked questions
My score dropped even though I didn't change anything. Is that possible?
Yes, and it can almost always be explained: new pages were published and carry issues, a previous crawl was partial, or a linked external resource went down. Compare the two crawls rather than the two scores.
What is the comparison between two crawls for?
To see the movements rather than the states: new issues, resolved issues, pages added or removed. It is the only view that proves a fix worked.
How long are crawls kept?
The project history keeps successive crawls, which you can view and compare from the Analysis history page. Deleting the project deletes them.
Try Noyaru
Create a project, run a crawl and browse your first report. No credit card required.
Create a free account