
Track performance and Core Web Vitals
A project's Performance page: Search Console data, PageSpeed measurements, LCP, INP and CLS, and why the URL sample is limited.
A project's Performance page brings together two things that are often confused: what Google observes about your search results, and how long your pages take to display.
Search data
If Search Console is connected: clicks, impressions, average position and click-through rate, page by page and query by query, over the configured period.
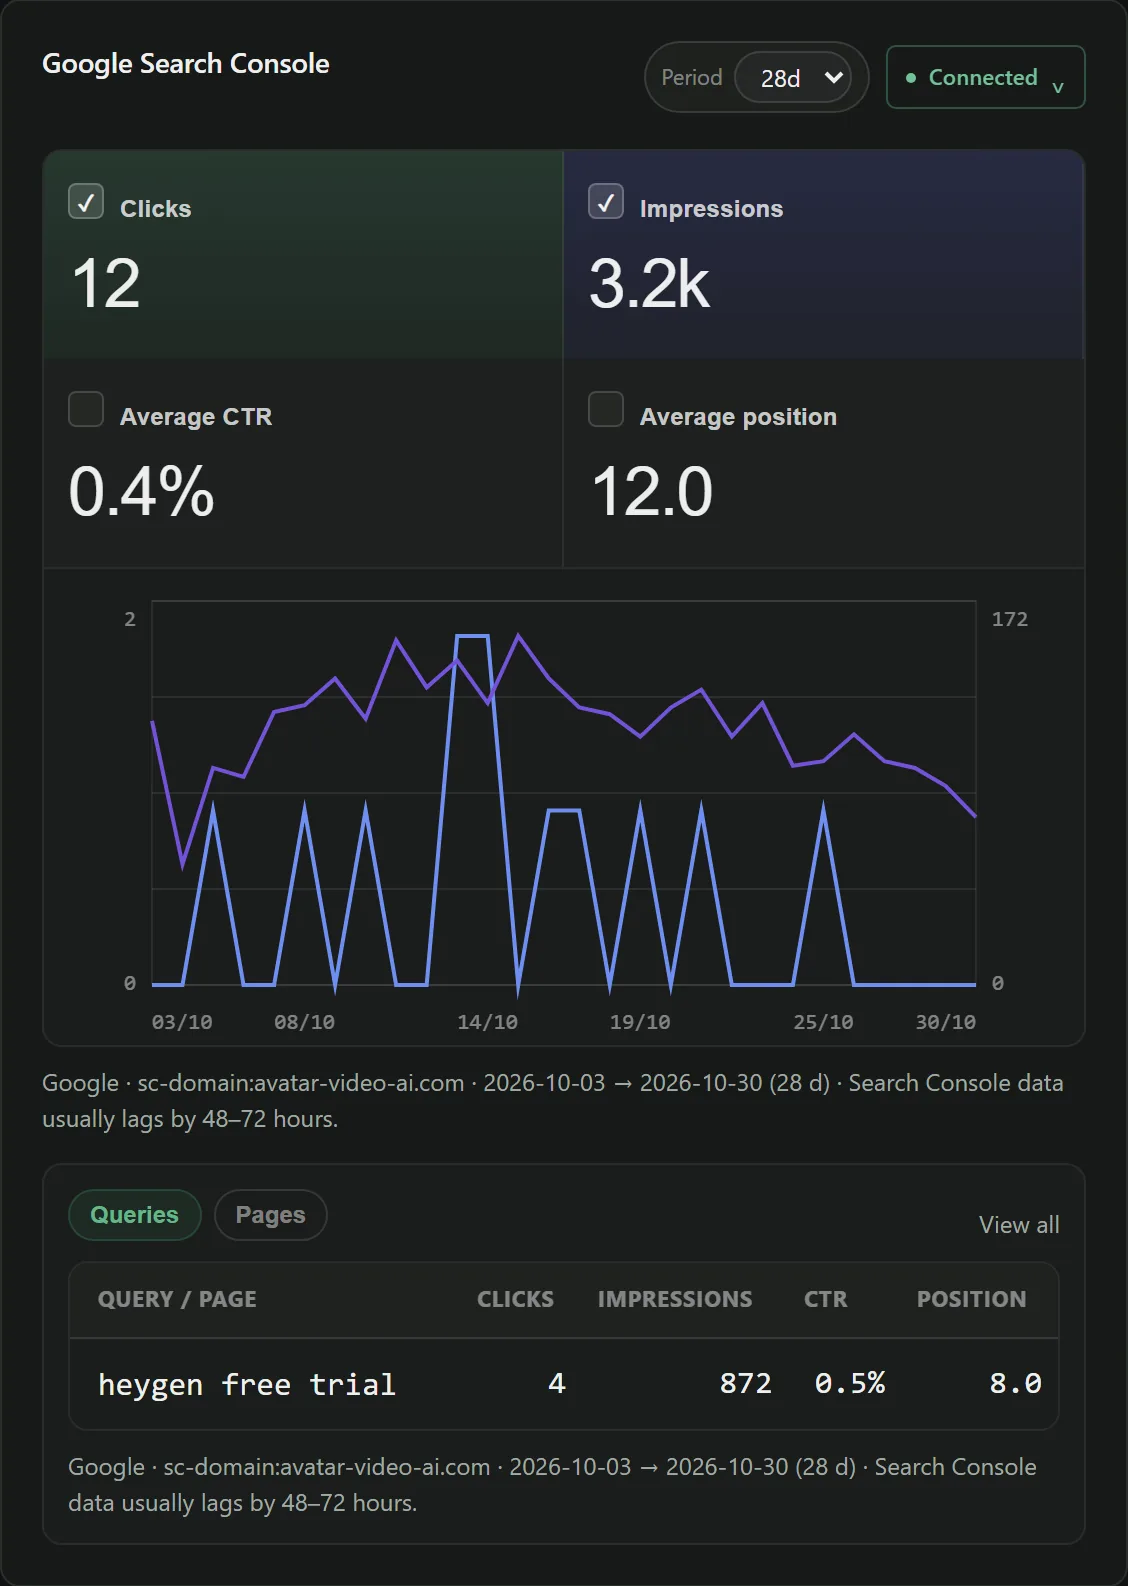
Two useful reflexes:
- Look at impressions before clicks. A page that loses impressions loses visibility; a page that keeps its impressions and loses its clicks has a shop-window problem, not a ranking problem.
- Remember the delay. Google publishes with a two- to three-day lag. A fix deployed yesterday doesn't show up today.
To turn these figures into actions, the neighboring page is more direct: Keyword opportunities.
Core Web Vitals
Three measurements, and a single question for each. To find out which ones really matter for SEO, read the guide Core Web Vitals: reading the signals without getting lost in the scores.
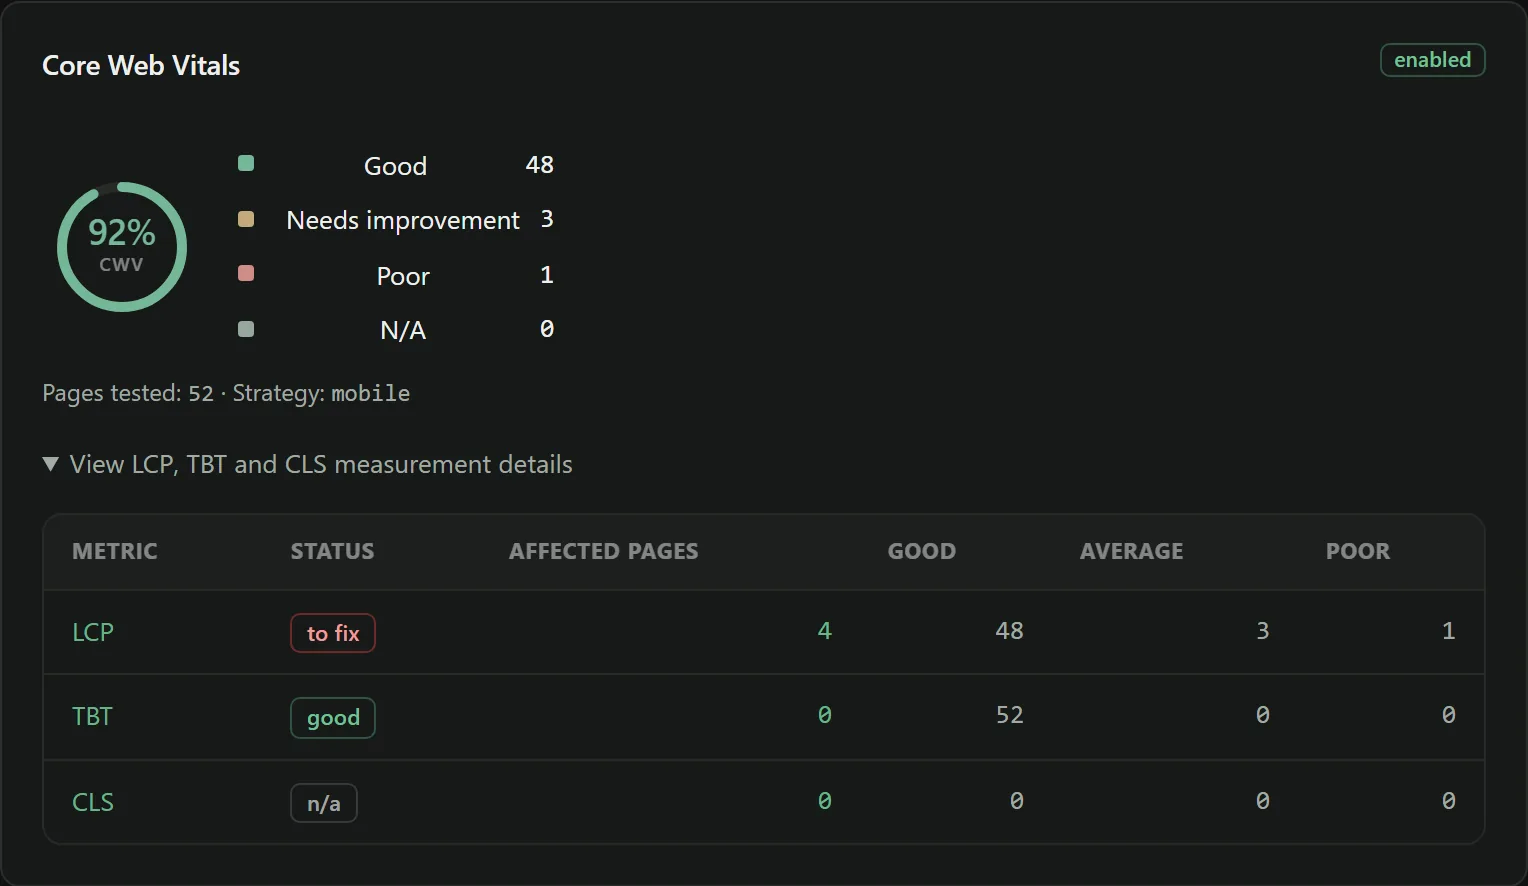
LCP — Largest Contentful Paint. How long before the main content is visible? Under 2.5 s is good. Beyond 4 s, the visitor sees a blank page long enough to leave.
INP — Interaction to Next Paint. How long between a click and the page's visible response? Under 200 ms is good. This metric replaced FID, which only looked at the very first interaction.
CLS — Cumulative Layout Shift. How much does the page move while loading? Under 0.1 is good. It's the measure of the button that moves just as you click it — almost always an image with no declared dimensions, a late-loading font, or a banner injected at the top of the page.
These three, and not the others
PageSpeed's overall score out of 100 is not a ranking factor, and a site scoring 62 can very well be doing better than a site scoring 95. Work on LCP, INP and CLS; ignore the race for the score.
Why a sample of URLs
Measurement goes through the Google PageSpeed Insights API, which is slow — several seconds per URL — and limited in the number of calls per day, a limit shared by the whole platform.
Hence a cap on the URLs measured per crawl, whose size depends on your plan.
You choose how many pages are measured, not which ones: Noyaru takes the first valid HTML pages (status 200), in alphabetical order of their addresses. A measurement is reused as long as the page has not changed. If an important template is missing from the sample, raise the number of pages to test, within your plan's limit.
You turn it on in the analysis settings, Extra data section, Core Web Vitals module: device tested (mobile or desktop), number of pages to test, maximum wait and simultaneous requests. Choose mobile: it's the index Google uses.
What a measurement doesn't tell you
PageSpeed measures in the lab: a simulated device, a simulated network, at a given moment. Two consecutive measurements of the same URL can differ noticeably depending on the load on your server.
What you read in Google's field data — the experience of your real visitors over 28 days — is not the same thing, and it's this second source that Google uses for its page experience signals.
Practical takeaway: follow the trend over several crawls, and never react to a single data point.
Connect performance to the rest of the audit
A slow page with no impressions is not a priority job. A slow page where you rank in position 4 with 8,000 impressions is.
That's the main benefit of having performance and search data on the same screen: sorting optimizations by the traffic they affect, rather than by the color of the score.
Fixing
The most common causes are fixed in the code or in the hosting configuration: unsized images, uncompressed images, render-blocking fonts, third-party scripts at the top of the page, no caching.
Some fall within the files Noyaru can modify — header and cache configuration, image dimensions in templates. Others fall under your hosting, and the product stays out of them: it flags them, you decide.
Frequently asked questions
Why do only a few URLs have a PageSpeed measurement?
Measurement goes through the Google PageSpeed Insights API, which is slow and subject to a daily quota. The sample is therefore capped, and its size depends on your plan. Pick URLs that represent your templates rather than trying to measure everything.
PageSpeed scores vary from one measurement to the next. Is that normal?
Yes. These are lab measurements, sensitive to server and network load at the time of the test. Follow the trend over several measurements, never a single data point.
Will a poor PageSpeed score make my rankings drop?
Not mechanically. Page experience signals carry little weight compared with content relevance. A slow page mostly loses visitors who give up before it displays — which costs more than rankings.
Try Noyaru
Create a project, run a crawl and browse your first report. No credit card required.
Create a free account